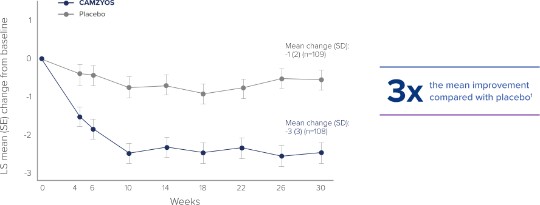
The efficacy of CAMZYOS was evaluated in EXPLORER-HCM, a phase 3, double-blind, randomized, placebo-controlled trial that enrolled 251 adult patients with symptomatic (New York Heart Association [NYHA] class II and III) obstructive HCM, with left ventricular outflow tract (LVOT) peak gradient ≥50 mmHg, and left ventricle ejection fraction (LVEF) ≥55% at rest or with provocation.1 Patients were randomized in a 1:1 ratio to receive CAMZYOS (n=123) or placebo (n=128) once daily for 30 weeks.1
All subjects were initiated on CAMZYOS 5 mg (or matching placebo) once daily, and the dose was periodically adjusted to optimize patient response (decrease in LVOT gradient with Valsalva maneuver), maintain LVEF ≥50%, and was further informed by plasma concentrations of CAMZYOS.1,2


